.jpg)
Mayela Zambrano
From spreadsheets to decisions - Dashboards in a week

Name: Mayela Zambrano
Profile: Sr. Data Engineer Consultant
Email: mayelazambrano9@gmail.com
How I divide my time
About me
I help businesses escape spreadsheet chaos by building automated dashboards in Power BI that turn data into decisions — in just one week.
With a background in social sciences and over 3 years of experience as a Senior Data Engineer, I combine technical expertise with a deep understanding of human behavior to create dashboards that are not only functional but also user-friendly and aligned with your business goals.
Resume
Passionate Sr. Data Engineer with a background in social sciences that can help you gain clarity on your data.
Sumary
Mayela Zambrano
Sr. Data Engineer Consultant
Education
Ph.D. in Hispanic Linguistics
2015 - 2020
University of Iowa, Iowa City
Conducted research in the social sciences and wrote academic articles
M.A. in Linguistics
2013 - 2015
University of Iowa, Iowa City
Theoretical and practical research for linguistics and Natural Language Processing
B.A. in Translation & Interpreting
2009 - 2013
University of Alicante, Spain
Language studies to become a translator in Spanish, English, French and Italian
Professional Experience
Freelance Sr. Data Engineer Consultant
2024 - Present
Remote
- Develop Power BI dashboards that translates messy data into business needs and opportunities
- Created automation strategies for small and medium-sized companies
- Conducted market research on specific action items
- Maintained database based on our business needs
- Created processes to automate data extraction
Senior Consultant Data Engineer
2024 - 2025
Iowa City, IA
- Designed and developed cloud-based data models and pipelines in Microsoft Fabric to integrate API data into the Lakehouse.
- Built Power BI dashboards to provide real-time insights for executive decision-making
- Streamlined data engineering processes to enhance efficiency and scalability.
Senior Data Engineer
2021 - 2024
Stepping Stone Advertising, New York, NY
- Developed User Research for the creation on dashboards in Power BI and MicroStrategy.
- Managed overview of a design project, from meeting stakeholders, user research to design
- Maintained database based on our business needs
- Created processes to automate data extraction
Services
Who I work with
I work with those who are tired of endless spreadsheets I design automated Power BI dashboards that deliver executive insights in one week — no more manual reporting.
Option 1: Starter Package (Audit + Prototype)
• Data source review • Wireframe/mockup of the dashboard • 1 working visual with live data
Option 2: Full Dashboard (Flagship)
• End-to-end Power BI dashboard (5–7 visuals) • Connect up to 3 data sources • Branded for your business • 1hr walkthrough & video tutorial
Option 3: Ongoing Optimization (Retainer)
• Monthly refresh/updates • New visuals or features (up to 3 per month)
Portfolio
These are some of the projects I've worked with
- All
- User Journey Mapping
- Apps
- Websites
- Dashboards
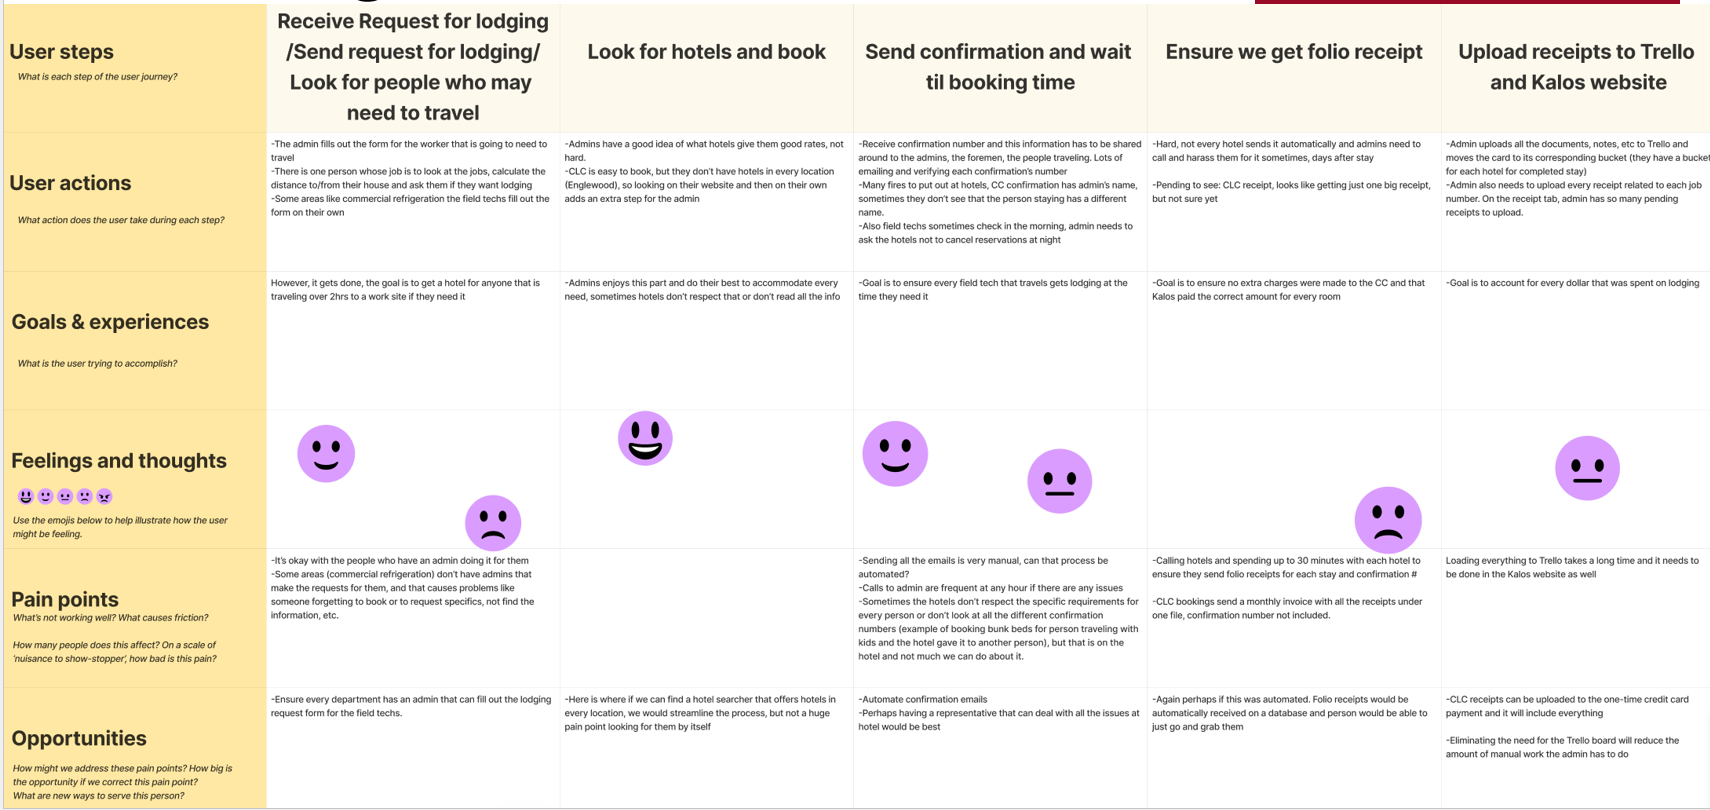
User Journey Map
Sample User Journey Map of the process to book accommodation for a construction company
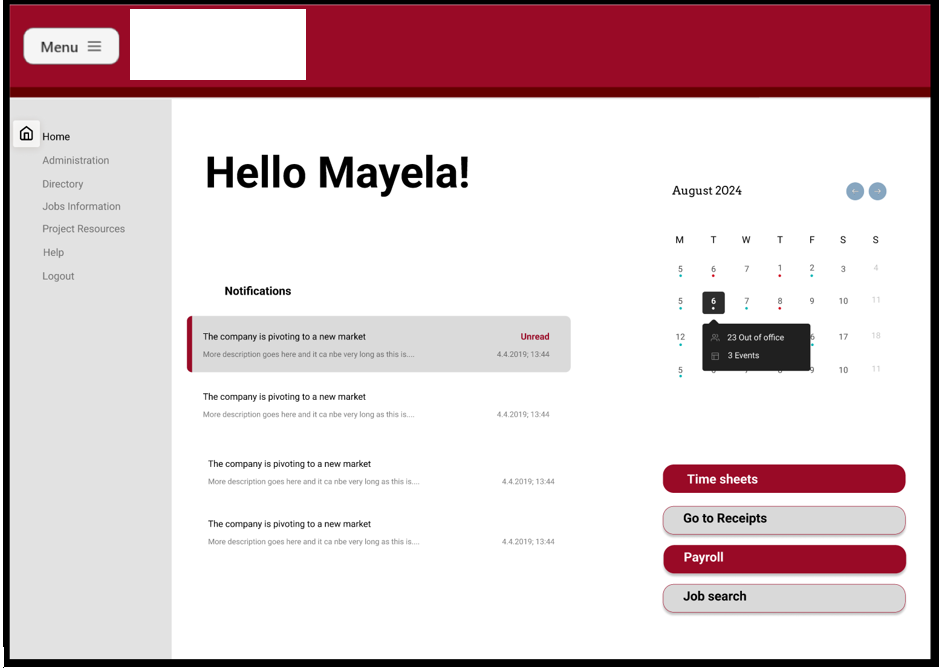
Website
This is a sample welcome portal for a company's website. It lets employees know of any messages or notifications assigned to them, what they have on the calendar, and quick access to what research demonstrated were the most important buttons.
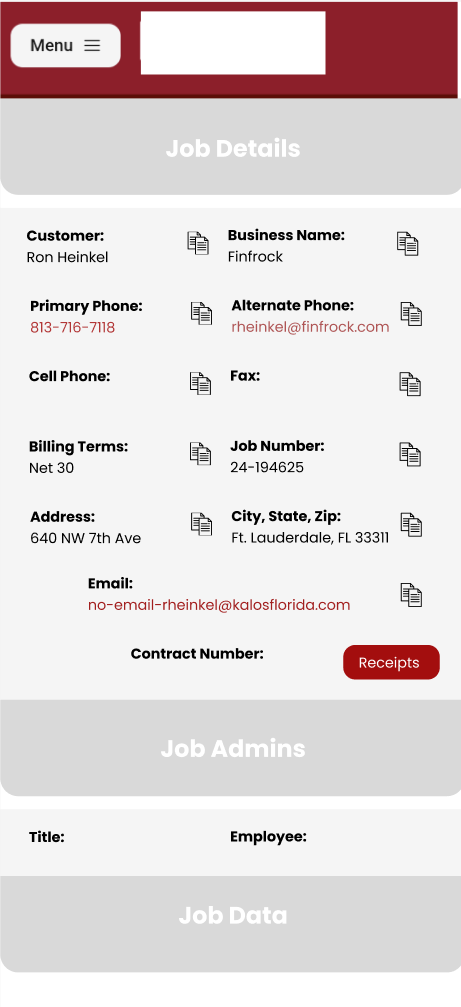
App 1
Designed the job information tab for employees to use on the company's app. Conducted research to learn about why they were not using the app. Found pain points with the layout and the ability to copy information. By adding icons to quickly copy the information on their phone, employees were much more likely to use it.
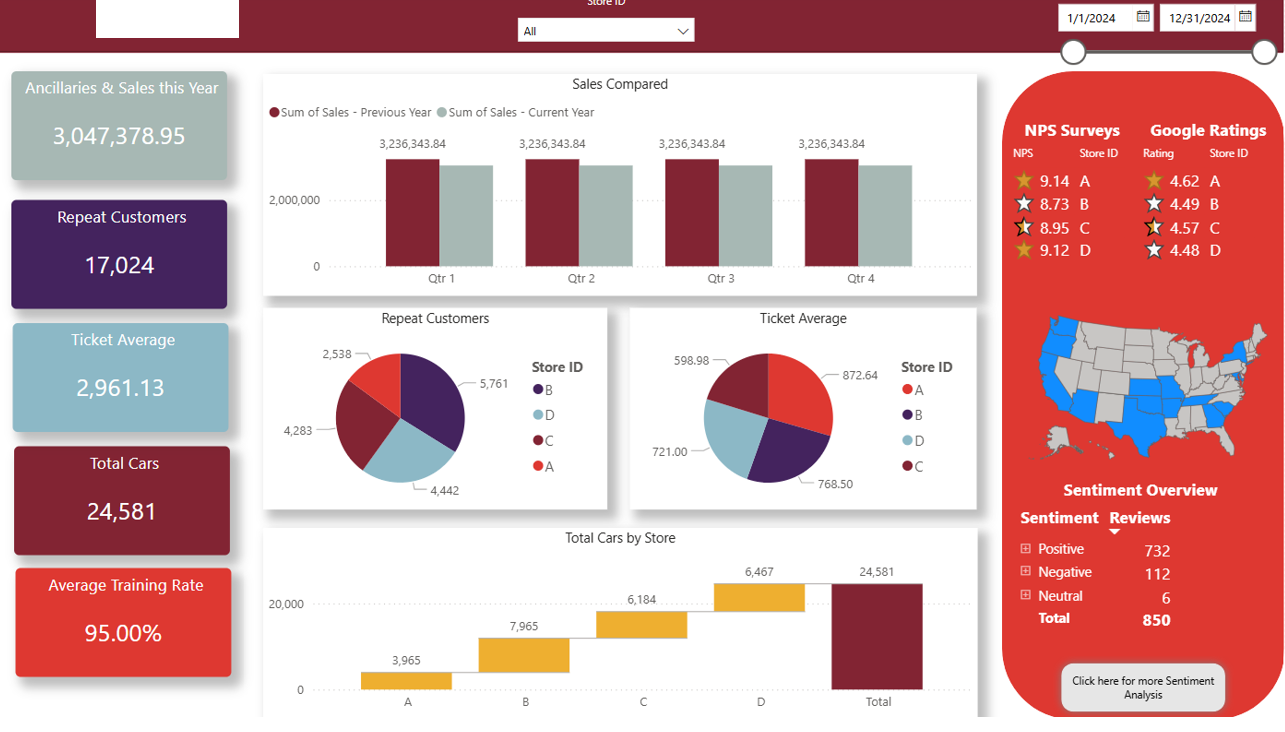
Dashboard 1
Sample dashboard correlating data from reviews and sales for each store for a large American corporation.
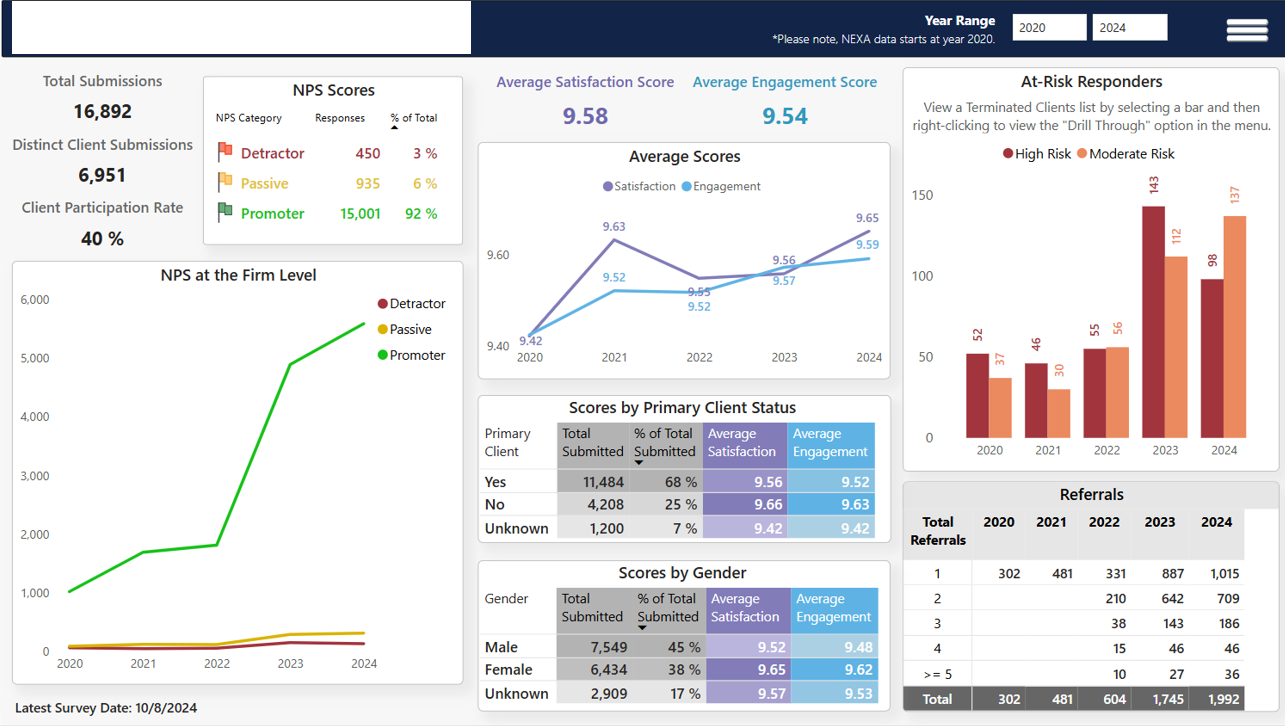
Dashboard 2
Dashboard created with survey data to explore satisfaction with the clients of a Wealth Management Firm<
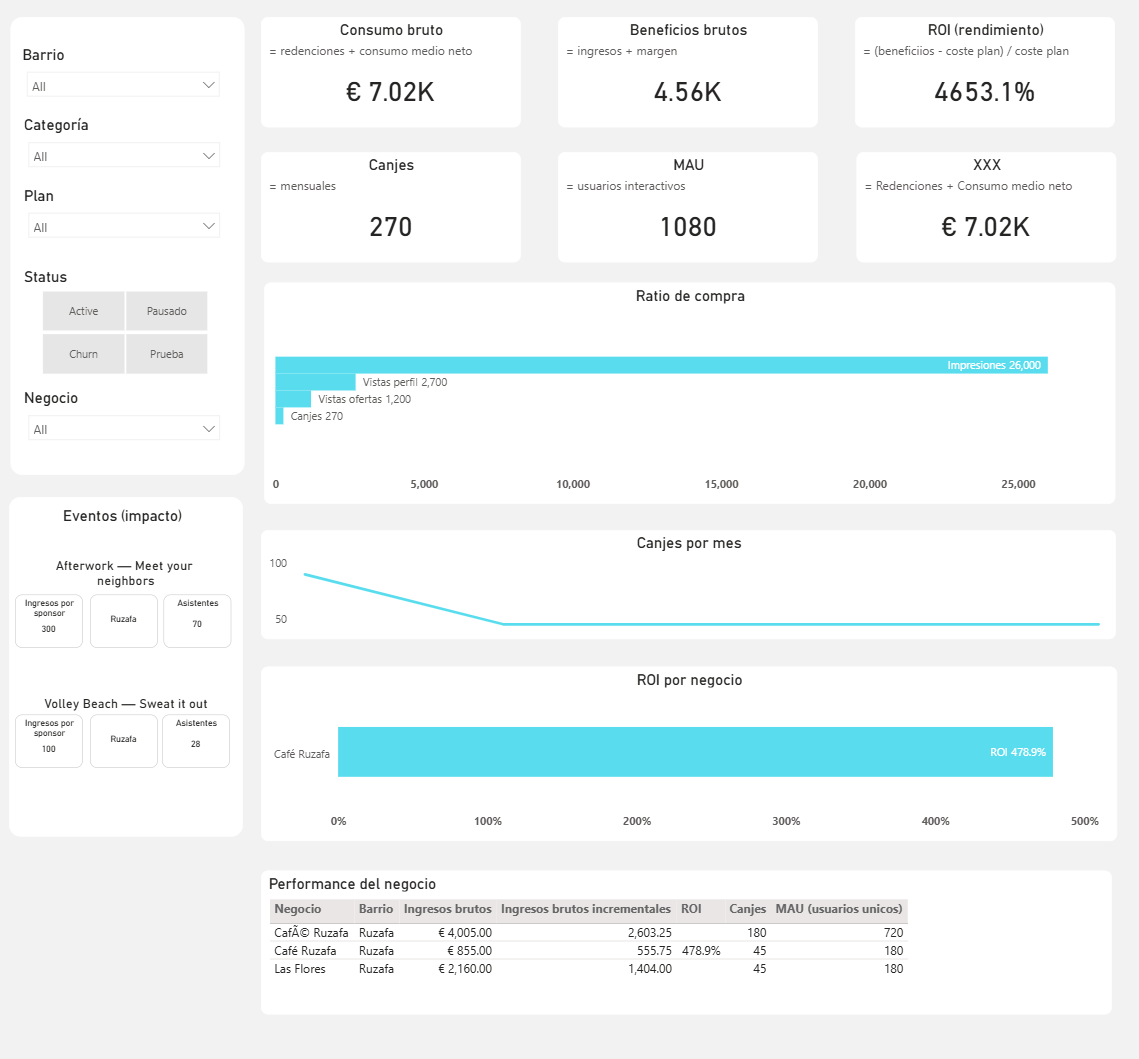
Dashboard 3
Dashboard created for an application that handles discounts for businnesses
Pricing
Option 1: Starter Package (Audit + Prototype)
Starting at $350 / $450
Option 2: Full Dashboard (Flagship)
$1,200 / €1,100
Option 3: Ongoing Optimization (Retainer)
$700 / €850 per month